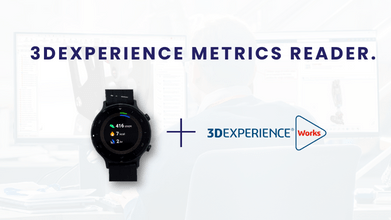
EXPERIMENT: Linking Google Fit Data to Metrics Reader
Prerequisites:
- 3DEXPERIENCE Platform Access
- Google Sheets/ Microsoft Excel access
- Smart Watch
- Google Fit Application Linked to Smart Watch
- Simple Weight Tracker app from Google Play

Step 1: Start using Smart Watch to record physical activity like Walking in my case.
Step 2: Link your Smart Watch application with Google Fit

Step 3: Pulling your google fit data from google:
Visit https://takeout.google.com/?pli=1 and select only Google Fit by deselecting all unwanted applications.

Step 4: Once the data is downloaded. Select the Daily activity metrics and upload the same on google sheets.
Step 5: Repeat the same with the simple weight tracker app which monitors your weight daily on the different sheets inside the same document of the above step.
Step 6: Go to Files> Publish to Web. Select the appropriate sheet number and keep the export format to .csv.


Step 7: Log in to the 3DEXPERIENCE Platform with the correct credentials.
Step 8: Drag the Metrics Reader App from Applications Panel to a tab inside the dashboard

Step 9: Click the Configure Icon> Select desired columns to display> Click Next> Select appropriate chart style and click Finish.

Step 10: Similarly repeat the same for other columns you want to display on the dashboard

Experiment Results:
Past 1-month weight loss is 4 Kg Approx.
Past 1 year I burned 1700 Kcal daily on average
Past 1 Year I walked 580Kms.
Daily Average step count for the past 1 month is 6000 steps.
3DEXPERIENCE can help organizations take better decisions faster and act as a single source of truth for your 3DCAD Data.
3DEXPERIENCE Platform is an innovative virtual twin technology by DASSAULT SYSTEMES which offers best in class experience of data and process management on the cloud powered by robust applications like Enovia, Simulia, SOLIDWORKS, etc.

Netvibes Solutions on 3DEXPERIENCE is a powerful tool for information intelligence.
- With the ongoing Industrial Revolution 4.0, Industries are digitizing the approach of analytics with solutions that help them with better and faster data-driven decision-making.
- With Netvibes Metrics Reader you can visualize your dataset with various types of Graphs and Charts that can be compared to each other to have a visual infographic on the dashboard.
With Metrics offers the following capabilities:
- Chart the data from your own datasets.

2. Analyze the chart.

3. Compare charts.

By using a platform that enables enterprise agility, innovation, and resilience and that:
- Connects all people, processes, and data
- Covers all business activities—design, simulation, and information intelligence—while providing a seamless, collaborative environment; and is
- Accessible from anywhere and everywhere via mobile/cloud
Panshul Technologies is a leading IT Service organization that believes in delivering cutting-edge technologies and services in the Indian manufacturing sector.
Transform the way you design, develop, and manage products with the power of 3DExperience. Sign up now for a demo and experience the difference for yourself. Join us and see how you can streamline your processes, collaborate with your team, and bring your products to market faster. Click the link below to schedule your demo today!


